
Page 8 - NOVAGOLD 2015 Annual Report
P. 8
capital – a trend we believe is long term in nature – the supply of gold from mines is likely to decline faster than conventional wisdom believes.
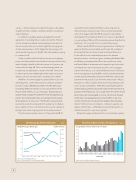
In addition to quantity, quality is plunging. The current generation of operating mines is well past its prime. The best ore has already been mined and remaining reserves will cost more to produce. We see no relief in sight; the average grade
of all producing mines is 32.6% higher than the average of all development-stage projects (fig. #3). This latter number is going to continue to fall.
Finally, to reinforce the fact that we have passed a tipping point, even if the mother lode of mother lodes were found today, which is highly doubtful, it will take as many as 20 years to get
it into production (fig. #4). This is not shale energy, which can
be explored and exploited in a matter of months. The barriers
to entry in gold are incredibly high and the steps necessary to develop a project are many, time-consuming and complex.
Whether or not mine supply has peaked, there is also very interesting news on the demand side. In a fine piece written
by metals analysts CPM Group entitled “The PBOC Changes Everything,” CPM opined that two announcements from the People’s Bank of China, in July and August, “dramatically and fundamentally changed the outlook for central bank gold buying patterns for the foreseeable future, and consequently the outlook for the gold price.” As they note: “The PBOC has fundamentally reversed its position toward gold, from seeing it as not likely to play a significant role as a monetary reserve asset to seeing it as playing a minor but on-going role in its monetary reserves.”
The first announcement came on 17 July, when the PBOC
revealed that it had added 19.4 million ounces of gold to its official monetary reserves in June. The second announcement came on 14 August, when the PBOC released its July statistics showing that it had added another 610,000 ounces of gold. Gold as a percentage of China’s official monetary reserves therefore has risen from 1.1% to around 1.6% as a result of these moves.
When I saw the PBOC’s increase in gold reserves, I initially was surprised that the amount added wasn’t larger. My assumption had been that the lion’s share of gold moving into China was
for the official sector and that the private sector demand infrastructure was a work-in-progress. Assuming the Central Bank isn’t fibbing or masking wider official sector purchases, it may well be that China’s investment sector interest in gold is broader and deeper than anyone had expected. This is encouraging to anyone who believes, as do I, that the Chinese investor will be an ever-increasing buyer of gold. CPM’s analysis opened my mind to another, equally interesting observation: While few central banks take their monetary policy cues from the central banks of Russia, Venezuela or similar countries which have been gold buyers, the same can’t be said for China. “While they may be loath to admit it, central banking authorities around the world will take more notice of, and place more emphasis on, such a major shift in the Chinese central bank’s policy stance toward gold. As a result, not only may the gold market expect on-going gold purchases by the PBOC, it also may
see other central banks revisiting the role of gold in their monetary reserves.” At the very least, it is likely to continue to suppress any urge by central banks – admittedly non-existent at present – to sell their reserves for a very, very long time.
Clearly, the supply and demand forces at work make owning
Declining Gold Head Grades fig. #3
Weighted-Average Gold Grade (g/t)
2.2
2.0
1.8
1.6
Gold Price (US$/oz)
$1,800 $1,500 $1,200 $900 $600 $300
Weighted-Average Head Grade
Gold Price
1.4 $0
2008
Based on 72 mines with 25% of 2013 world gold production.
2010
2011
2012
2013
2004 2005
2006
2007
2009
Data sourced from SNL Metals & Mining.
Time from Discovery to Production fig. #4
Average Number of Years from Discovery to Production
35
30 25 20 15 10 5 0
Data sourced from SNL Metals & Mining. *Projected.
Startup Year
6
1985 1986 1987 1988 1989 1990 1991 1992 1993 1994 1995 1996 1997 1998 1999 2000 2001 2002 2003 2004 2005 2006 2007 2008 2009 2010 2011 2012 2013
2014* 2015* 2016* 2017* 2018* 2019*
